Hydrogen is the most common element in the universe and will soon be a primary energy source on earth. As the world is becoming more familiar with this zero-emission energy, we’re also becoming aware that not all hydrogen production is equal in environmental impact. Some methods convert water, relying on electricity either from the power grid or renewable energy sources such as wind turbines, solar panels, and hydroelectricity (known as electrolysis). Other forms of production take advantage of natural gas through steam methane reforming (SMR). Whatever the methodology used to create hydrogen, there are variables within these methods that affect the overall carbon impact of the hydrogen.
Of course, the production method is only one consideration in evaluating hydrogen as an energy source. To use hydrogen, it must be compressed, transported, and either combusted or converted to electricity using a fuel cell. So, as you can see, it gets complicated rather quickly. That’s why looking at the overall carbon intensity of hydrogen is critical to determining the true emissions of this technology in each application. Carbon intensity looks at lifecycle emissions, providing a more accurate and complete picture of hydrogen’s emissions impact. This blog will explain the differences between carbon intensity and color and why the former provides a better understanding of the environmental attributes of hydrogen production.
Colors Can Be Deceiving
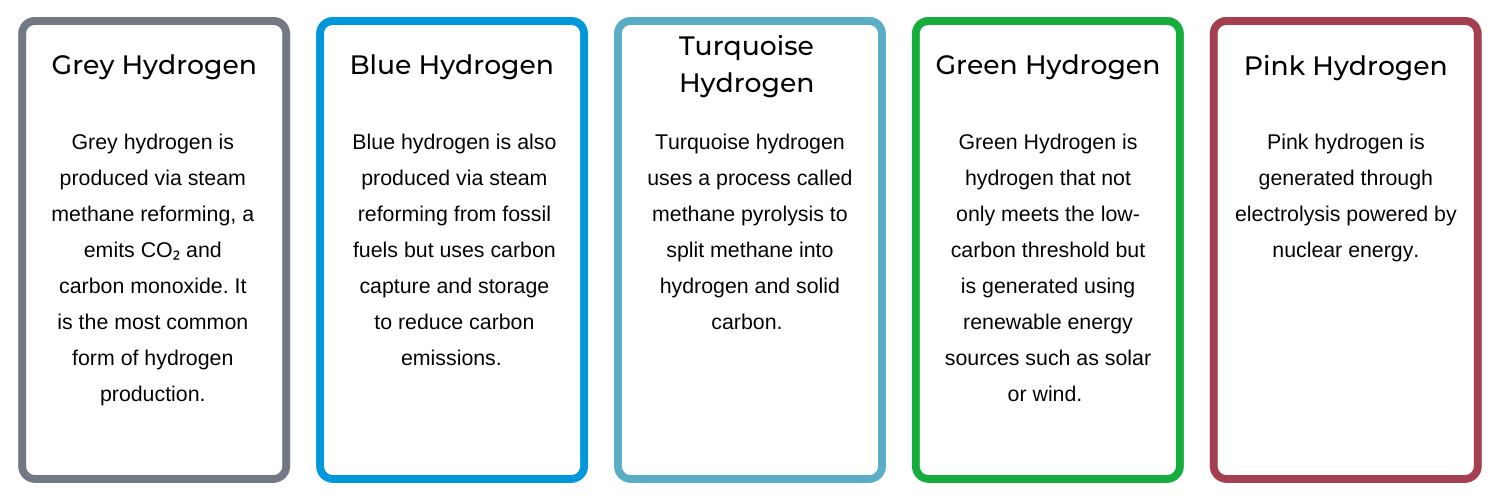
Hydrogen is often oversimplified and associated with a color based on the source of the molecule.
The most common colors discussed in the color model are Green, Blue, Grey and Black. Green hydrogen is produced from water through an electrolysis process by employing renewable electricity. Blue hydrogen is sourced from fossil fuel with the CO2 captured and stored underground (carbon sequestration). Grey hydrogen is produced from fossil fuel and commonly uses steam methane reforming (SMR) with CO2 being the only waste product. Black hydrogen is generated from coal and is the most environmentally impactful production method.
Each color is meant to represent a different method of hydrogen production based solely on the associated emissions profile at generation and does not include all the steps associated in the entire transportation cycle through the end use point of the hydrogen.
Accounting for the carbon intensity through the entire value chain presents a very different picture, including a wide range of results that challenge many long-held beliefs about the overall environmental impact in the hydrogen sector.
Carbon Intensity Drivers
As mentioned, considering the energy and resources used to generate the hydrogen and the emissions released to get the hydrogen to the point of use is important. Looking at factors such as production methods, distance between production and point of use provides a much more accurate picture.
Production method and feedstock
Hydrogen production’s environmental impact is more complicated than it first appears, and there are many factors that determine hydrogen’s overall carbon intensity, namely the method and feedstock used. For example, electrolysis may appear to be the truly “green” solution, but the energy grid it draws power from may be powered by coal. In these situations, it may be more eco-friendly to use steam methane reforming to produce hydrogen from natural gas. This isn’t obvious if we were to simply rely on the established color system.
Distance between production and point of use
Currently, most hydrogen production happens in centralized locations and is transported long distances via diesel trucks to the point of use. To be transported this way, hydrogen must be liquefied, which is an energy-intensive process. One way to reduce emissions is by green long-haul transportation through the use of fuel cell electric vehicles instead of using diesel. However, until the necessary infrastructure is built to support green trucking, even the cleanest hydrogen will create a carbon footprint simply due to the current transport requirements. BayoTech believes that the best solution is to develop locally distributed hydrogen hubs. Local production not only minimizes transportation emissions but eliminates the need for liquefaction.
How Local SMR Reduces Carbon Footprint and Cost

Electrolysis is often assumed to be the cleanest option of hydrogen production by default. However, that assumptions begins to change if we dig into the details and compare electrolysis to certain forms of SMR.
The CA GREET 3.0 model was developed by the California Air Resources Board to provide estimated CI scores for a variety of different energy pathways, and is one approach that is recognized and respected by many industry experts and policymakers across North America. With this context, let’s explore the colors of the most common forms of hydrogen production and each colors true carbon intensity.
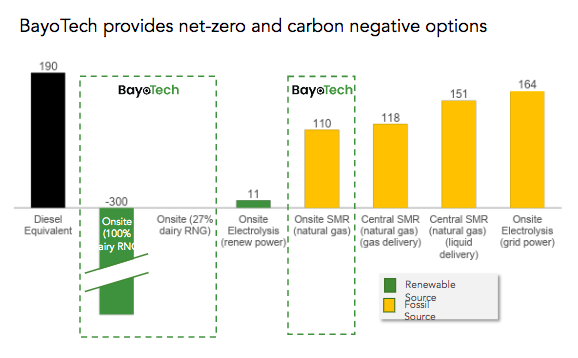
Most electrolysis in the US today is powered by grid electricity, which is primarily generated from fossil fuels. Even assuming the energy grid is comprised of 30% renewable energy, the result is a net 164 carbon intensity (CI) score. That’s higher than almost any other production pathway. Electrolysis can only be truly carbon-neutral when it’s powered by wind or solar energy sources. Even then, such infrastructure is typically located a long distance from where the hydrogen is being consumed, which requires long-distance shipping of the fuel—adding further costs and pollution into the mix.
Meanwhile, hydrogen generated via natural gas-fueled SMR technology achieves a CI score between 110-151, depending on the need for compression or liquefaction and transportation. Its baseline is already lower than electrolysis.
Renewable natural gas (RNG) sourced from agricultural, municipal waste, and other biogenic sources can further support carbon emission reductions, by providing low or negative carbon feedstock for hydrogen production, with some dairy RNG achieving -300 CI scores. In turn, this can allow an SMR system to generate carbon-negative hydrogen, something that’s not possible with electrolysis.
Finally, the cost of producing hydrogen through electrolysis is still expensive, costing upwards of $9/kg. Because SMR is a more energy efficient process than electrolysis, the hydrogen can be produced at much lower cost, ranging between $3-$6/kg.
Final Thoughts
Although people are more familiar with the current hydrogen color system, we believe that analyzing the overall carbon intensity for each hydrogen production method provides a more complete picture of the overall carbon footprint of hydrogen production. Using CI as a form of measurement allows us to accurately see the total emission caused by the liquefaction and transportation, along with the carbon required to create green hydrogen.
The truth is that this is the exciting beginning of the hydrogen economy, and the infrastructure to produce and deliver hydrogen to the end-user network is still being developed. Hydrogen generated via SMR from fossil fuels is an economical, low-carbon stepping stone on the path to net-zero emissions. As hydrogen demand continues to grow, the CI of hydrogen generation will continue to fall as production methods evolve.


